
AI can compress coding time faster than it compresses delivery cost.
The price should reflect the work and accountability that remain: the expertise, verification and security needed to deliver an accepted result.
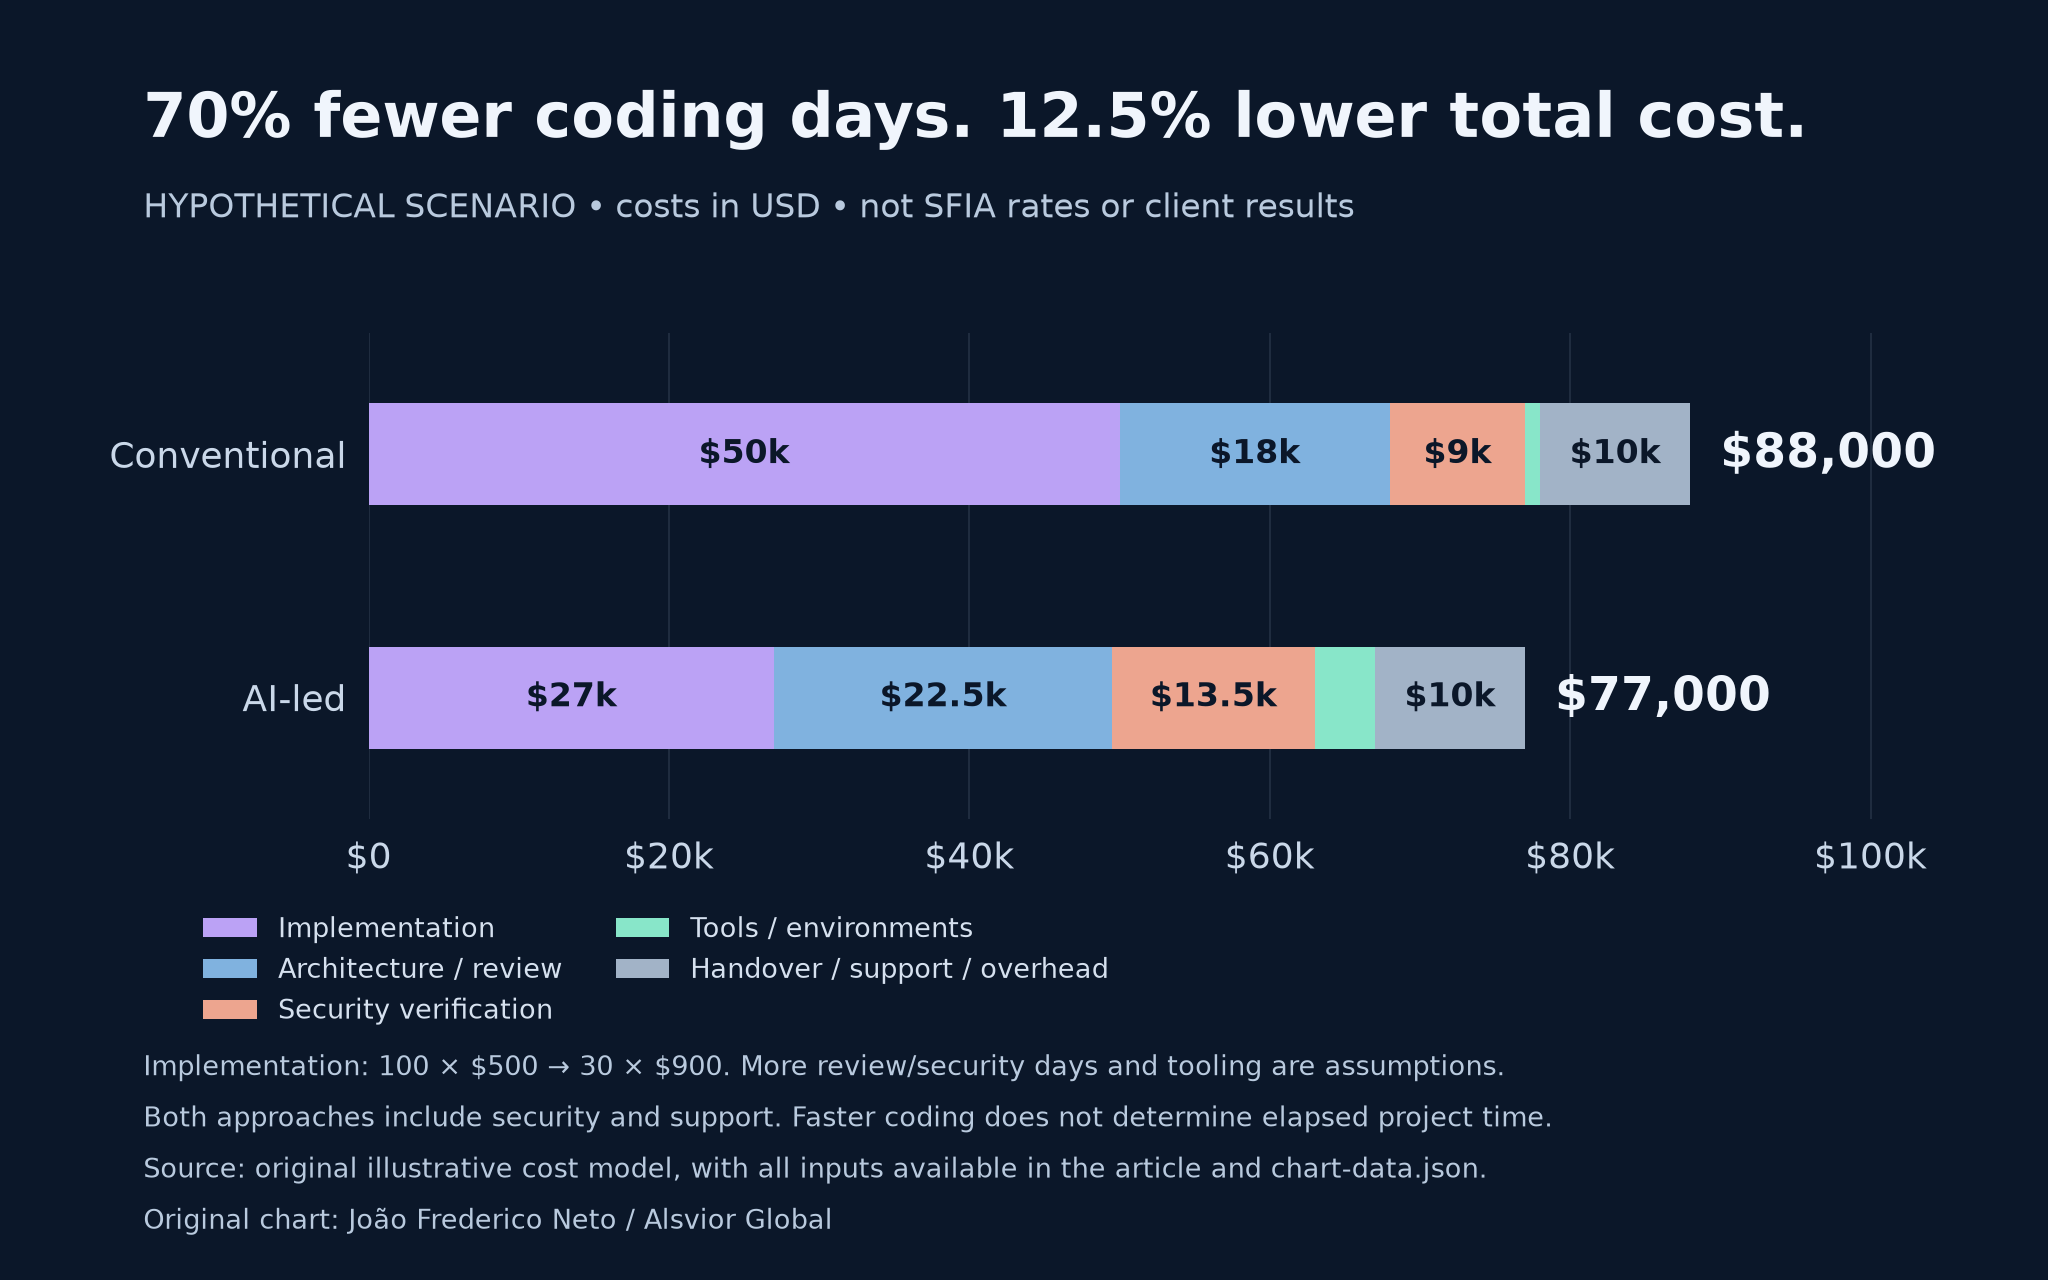
Hypothetical internal delivery costs: $88,000 conventional and $77,000 AI-led. Implementation person-days fall 70%; total cost falls 12.5%. Original chart: João Frederico Neto / Alsvior Global.
Read the assumptions and accessible cost table ↓Download PNGDownload SVG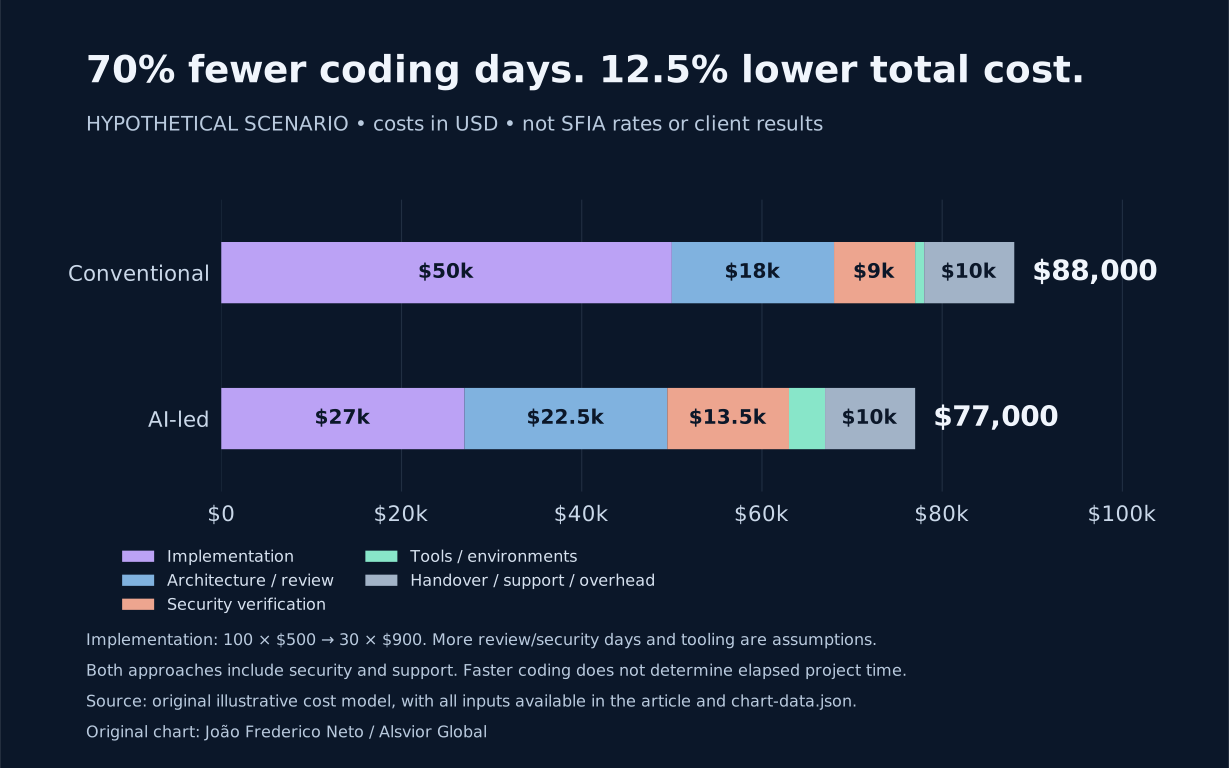
Measure the saving in the right unit
A 2023 controlled Copilot experiment found a JavaScript HTTP-server task was completed 55.8% faster. A larger field study across 4,867 developers reported 26.08% more completed tasks. Those are different measures, in different settings; neither establishes a universal 50–80% reduction in end-to-end development cost. Task experiment · Field study
Measure implementation, review, integration, rework and release separately. Price from accepted delivery, rather than assuming every hour removed from coding disappears from the project.
A smaller team can have a different skills mix
SFIA describes levels of responsibility, not a universal rate card. Level 5 covers authoritative guidance and accountability for significant outcomes; Level 6 includes organisational influence and high-level decisions. SFIA L5 · SFIA L6
An AI-led delivery team may need a greater proportion of senior architecture, assurance and decision-making capacity as routine implementation shrinks. That is a staffing choice to justify against the work—not evidence that every task previously done at L2–L4 must now be performed at L5–L6.
Fund the responsibilities that remain: understanding requirements, challenging generated designs, validating integration, accepting security decisions and authorising release. Automate appropriate parts of that assurance too.
Security belongs in the delivery model
Verizon’s 2026 DBIR reports vulnerability exploitation as the entry point in 31% of breaches. The UK NCSC’s 2025 review reported 204 nationally significant incidents, against 89 in the preceding reporting year. These are different datasets, not counts of AI-caused breaches. Verizon · NCSC
Separately, the NCSC assesses that AI will make elements of cyber intrusion more effective and efficient. This is a threat assessment, not a measured attribution of those incident totals. NCSC assessment
Secure development was already necessary. AI coding adds practical questions about agent permissions, secrets, untrusted instructions and generated dependencies. Fund appropriate threat modelling, isolated execution, access controls, independent checks and recovery. If the delivered product also contains AI agents, assess their runtime authority separately. Agent guidance
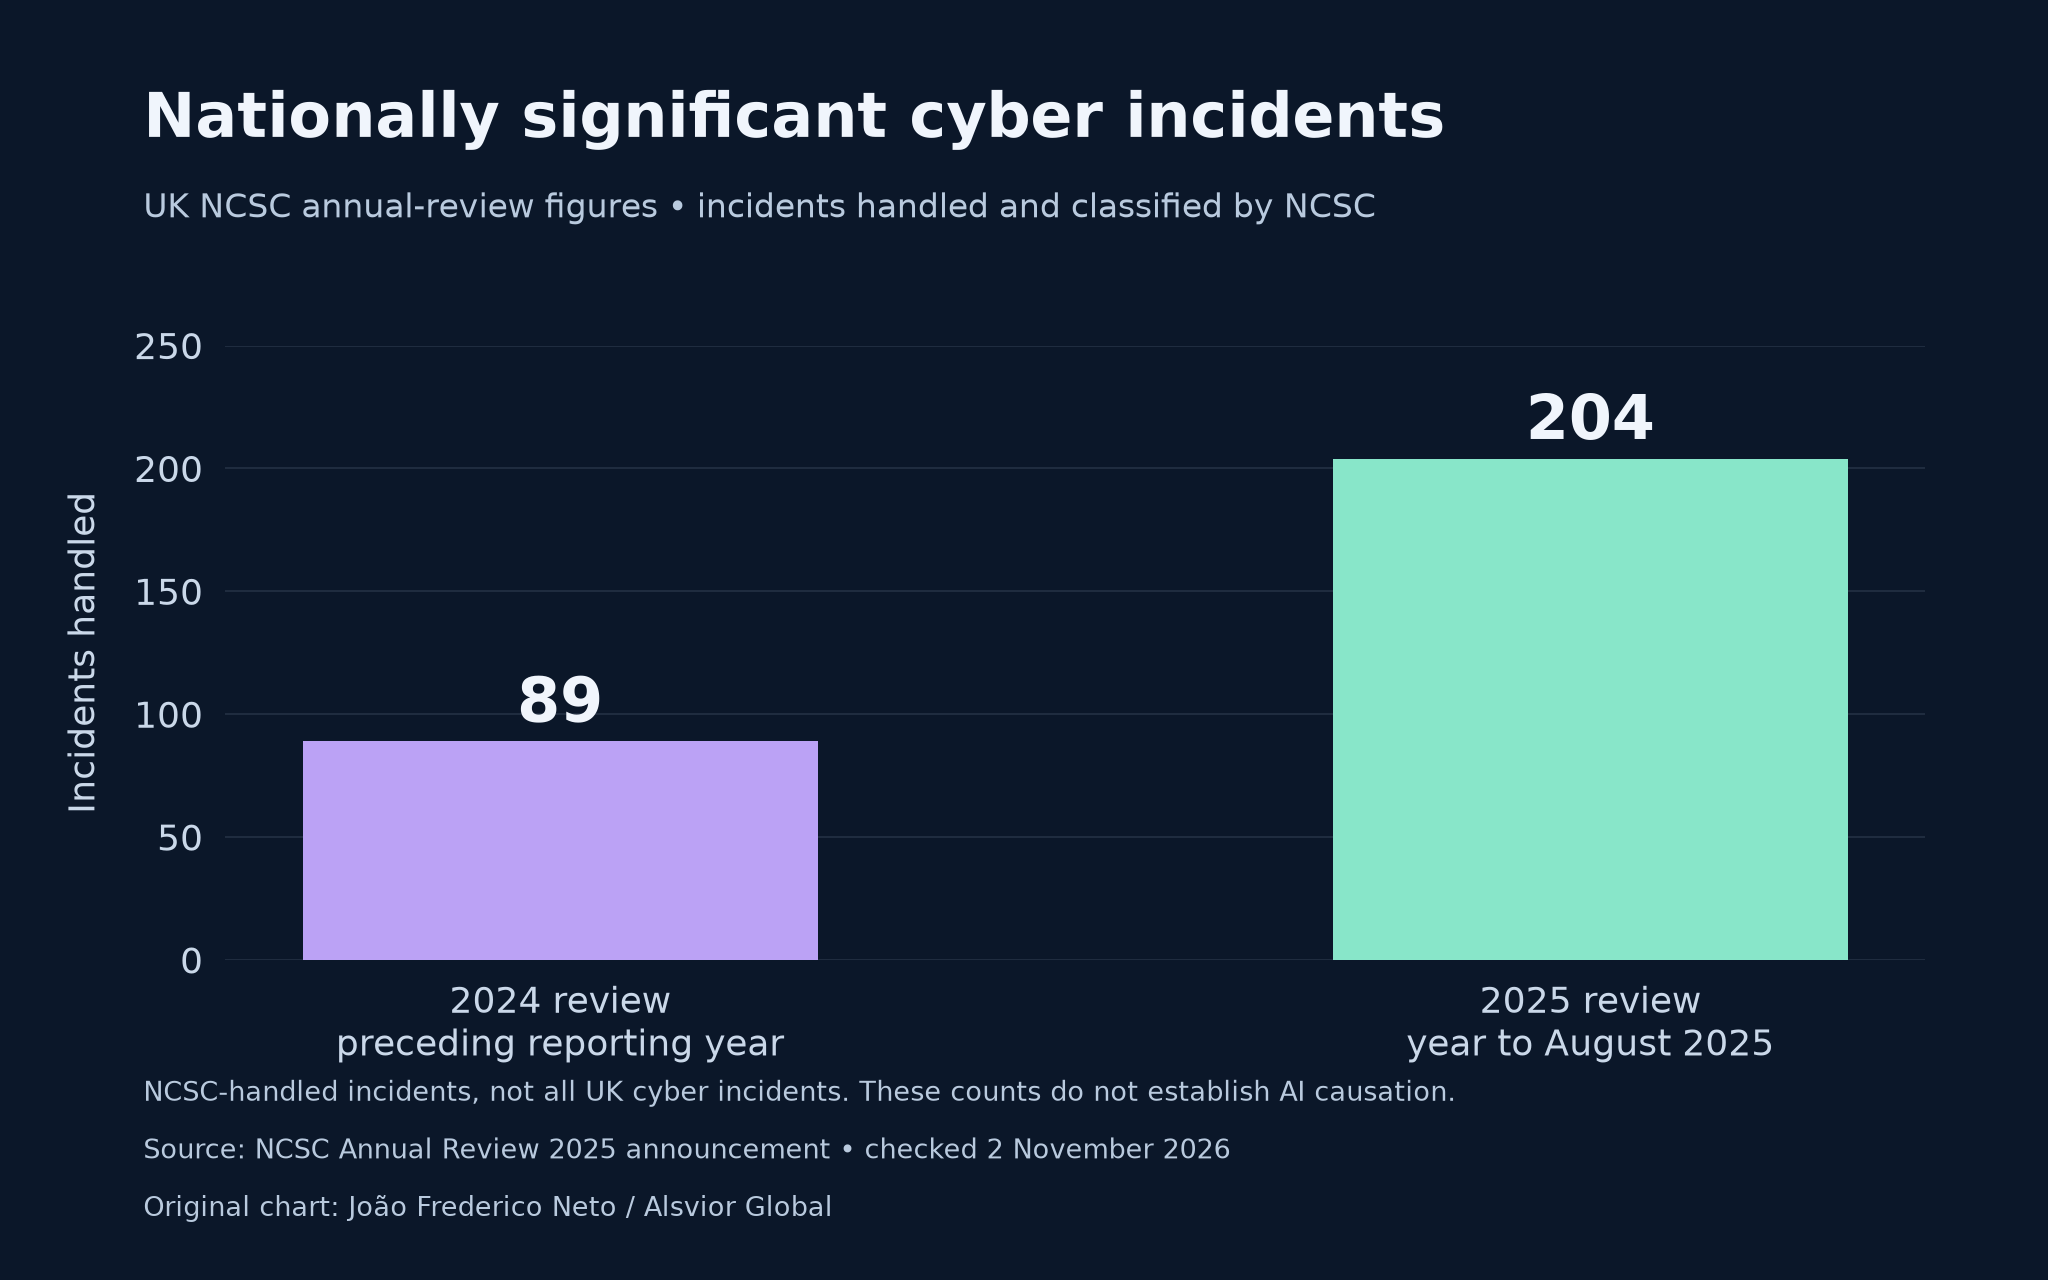
89 → 204 nationally significant incidents handled by NCSC. The 2025 review compares the preceding reporting year with the 12 months to August 2025, as specified in the source’s body. These are NCSC-handled incidents, not all UK incidents or 2026 review results. No AI causation is established.
NCSC source. Original chart: João Frederico Neto / Alsvior Global.
Download PNGDownload SVG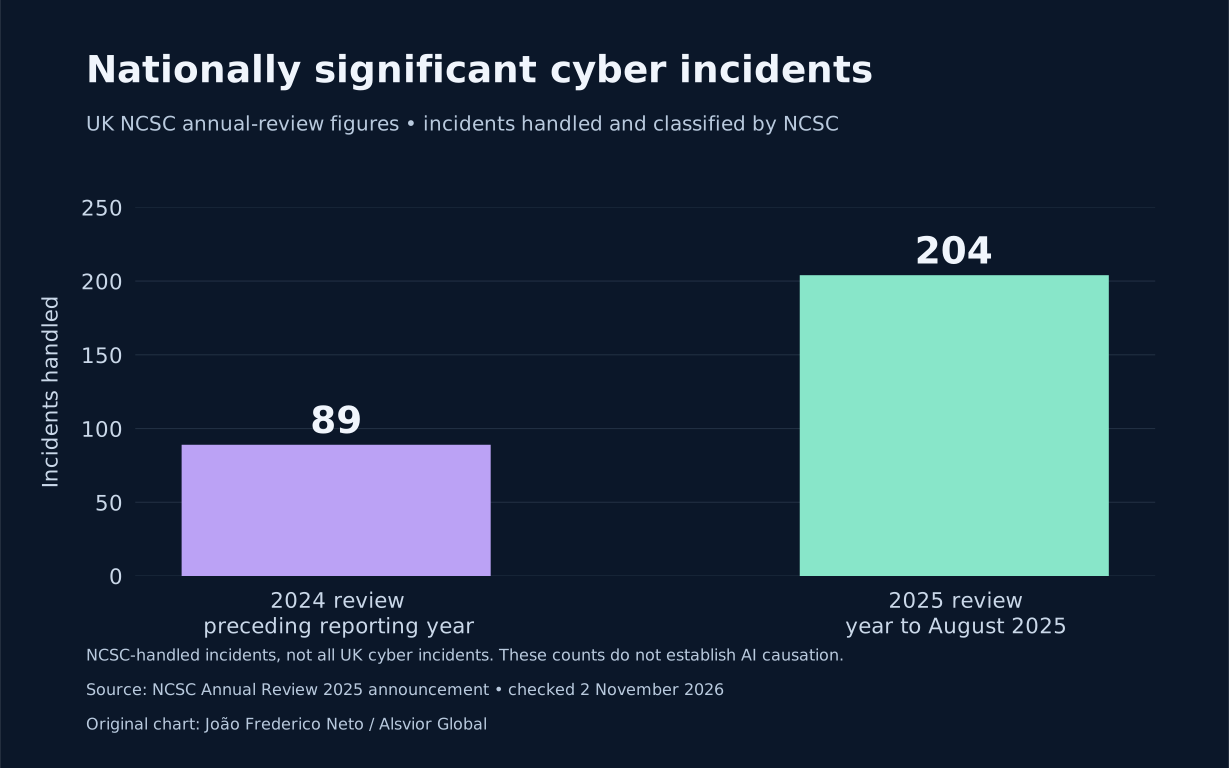
| Reporting period | Nationally significant incidents |
|---|---|
| Preceding reporting year | 89 |
| 2025 review · 12 months to August 2025 | 204 |
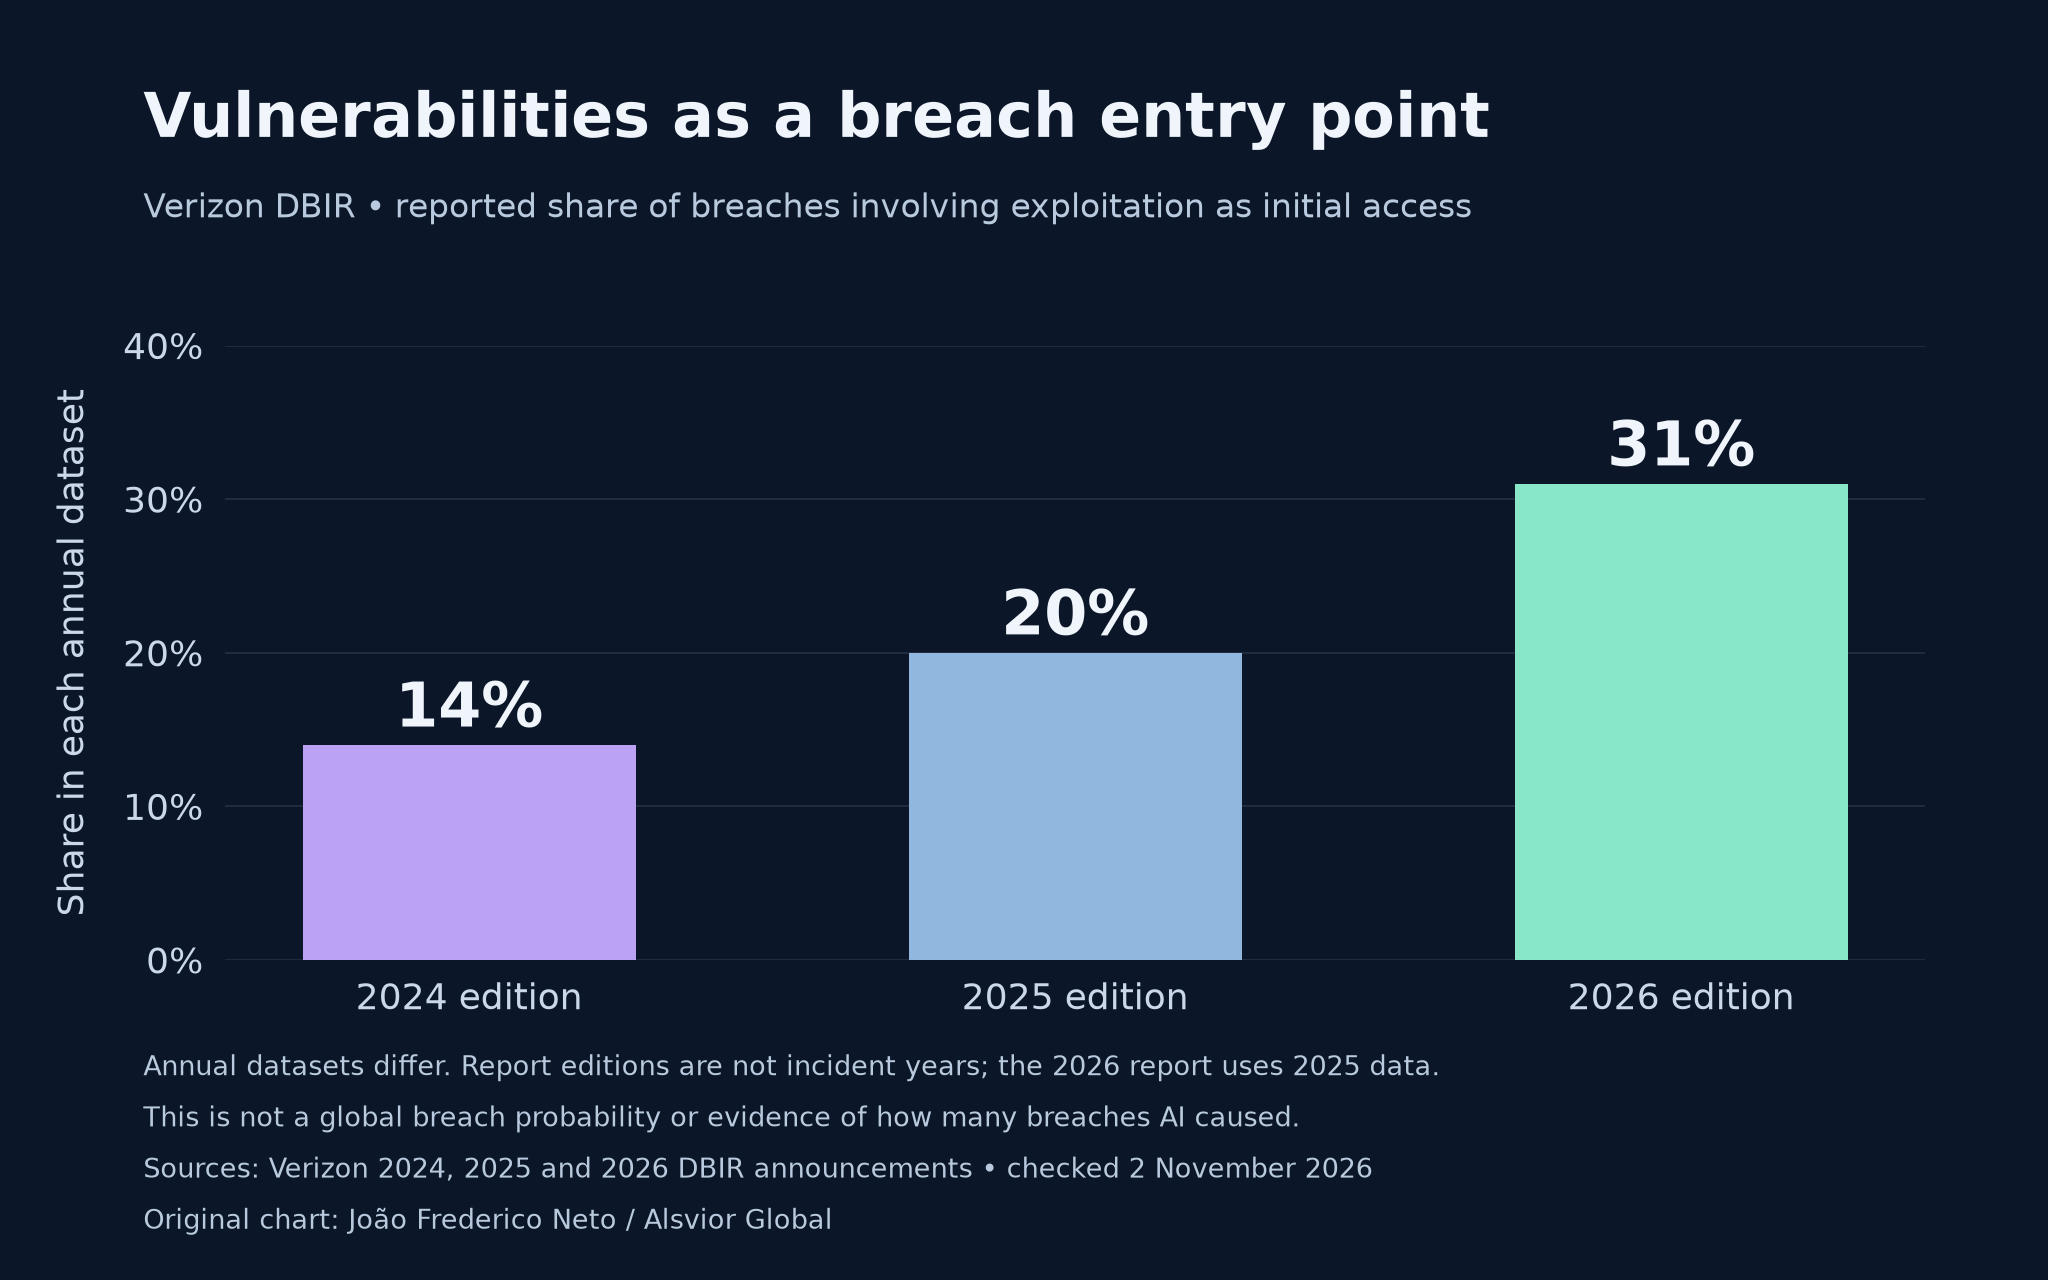
Vulnerability exploitation as initial entry: 14%, 20% and 31% in the 2024, 2025 and 2026 DBIR editions. These are different annual contributed datasets. Report editions are not occurrence years; the 2026 announcement uses 2025 data. The series does not establish AI causation.
Sources: Verizon 2024, Verizon 2025, Verizon 2026. Original chart: João Frederico Neto / Alsvior Global.
Download PNGDownload SVG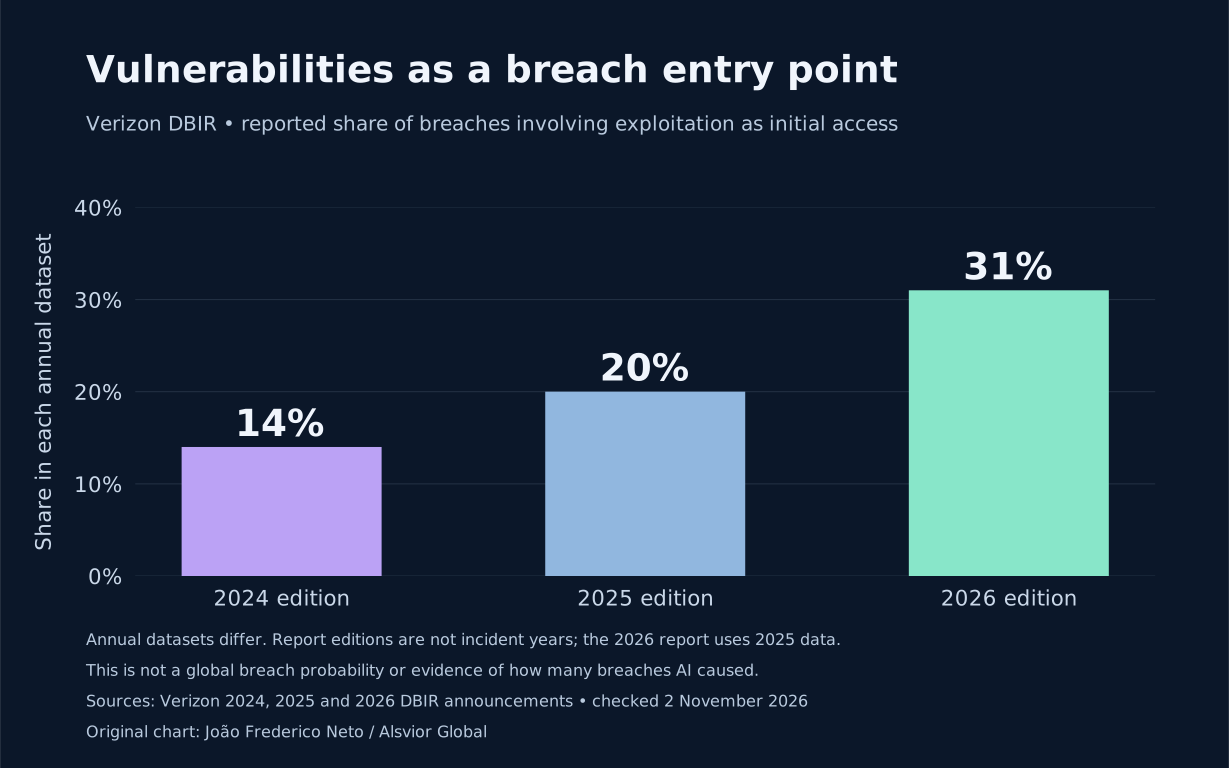
| Report edition | Breaches with vulnerability exploitation as initial entry |
|---|---|
| 2024 | 14% |
| 2025 | 20% |
| 2026 | 31% |
Translate time savings into a complete cost comparison
Consider this hypothetical project. All amounts are in USD. Day costs are illustrative internal delivery costs, not SFIA tariffs or market benchmarks. The work categories do not overlap.
| Cost component | Conventional delivery | AI-led delivery |
|---|---|---|
| Implementation | 100 days × $500 = $50,000 | 30 days × $900 = $27,000 |
| Architecture and review | 20 days × $900 = $18,000 | 25 days × $900 = $22,500 |
| Security verification | 10 days × $900 = $9,000 | 15 days × $900 = $13,500 |
| Tools and environments | $1,000 | $4,000 |
| Handover, support allowance and overhead | $10,000 | $10,000 |
| Total | $88,000 | $77,000 |
Implementation days fall 70%; total cost falls 12.5%. The higher-cost implementation mix and additional assurance are assumptions to test, not inevitable consequences of AI.
With the same illustrative 40% contribution target, the price floor falls from approximately $146,667 to $128,333. The customer can receive a lower price while the supplier funds the agreed responsibility. This calculation does not establish market willingness to pay or company profit.
Budget AI honestly
AI usage is not free, but expensive tokens alone are a weak justification for a substantial fee. Anthropic currently lists Sonnet 5.5 at $2 per million input tokens and $10 per million output tokens. Hypothetical usage of 100 million uncached input tokens and 10 million output tokens would therefore cost $300 at those base rates, before other charges or adjustments. Pricing, checked 2 November 2026
Track actual consumption, retries, test infrastructure and security tooling. The $4,000 line above is an assumed combined project budget, not a claim about a typical model bill.
Price the commitment and revisit the evidence
For defined work, quote an accepted capability with milestones, change boundaries, ownership terms and a support period. For substantial uncertainty, start with paid discovery or a capped phase.
For time-based billing, record actual agreed effort. For a fixed fee, state who pays variable AI usage and what support is included.
Explain any risk allowance through specific obligations, expected rework and residual uncertainty. Avoid double-counting the same risk in both delivery estimates and a contingency.
Keep the customer’s benefit and alternatives visible. Update quotes as delivery costs and competing offers change. A durable pricing argument is the value of accepted software and the responsibility retained—not the hope that buyers have yet to notice cheaper coding.
Test the economics.
Change implementation effort, day costs, review, security and tooling. Compare total cost and the fee needed for a chosen contribution margin.
Open the Development Pricing Lab